
In the fast-paced and volatile world of cryptocurrency markets, using advanced technical analysis tools is essential for traders' success. One such efficient tool that is highly popular among professional analysts is the Ichimoku Indicator (Ichimoku Kinko Hyo).
As a comprehensive analysis system, Ichimoku allows traders to gain a complete picture of both the current and future states of the market. This indicator not only helps in identifying the trend direction but also plays a key role in determining the best entry and exit points for trades.
Interestingly, the development of Ichimoku took more than three decades to reach its current form. The result of these years of research is now available to financial market users and has secured a special place among technical analysis tools.
Given that a proper understanding of market behavior can significantly increase the chances of profitability, this article aims to provide a complete overview of the Ichimoku indicator and how to use it effectively for more accurate analysis.
What Is Ichimoku and How Is It Used in Technical Analysis?
The Ichimoku indicator, now one of the key tools in technical analysis, was developed by Goichi Hosoda — a Japanese journalist and analyst — and was publicly released in the late 1960s. This tool holds a special place particularly among Asian traders due to its Japanese origins and unique design.
The term Ichimoku Kinko Hyo translates to "One Look Equilibrium Chart" in English — a concept that clearly reflects the tool's purpose: the analyst can get a comprehensive overview of price trends, market direction, and buy/sell signals at a glance.
While the Ichimoku chart may visually resemble candlestick charts, its features go well beyond a simple tool. Ichimoku provides more complex data and uses various types of averaging to deliver precise information about support and resistance levels, trend strength, and market direction.
This indicator consists of several key components that together provide a comprehensive picture of the market. The information derived from these elements is presented in a visual area called the Ichimoku Cloud, one of the most recognizable parts of this tool and frequently used by analysts to identify entry and exit points.
Although technically categorized as an indicator, many experts consider Ichimoku more than that — in fact, a complete trading system. That’s because each component of the tool plays a significant role in the analysis, and accurate interpretation of them can form effective trading strategies.
Why Is the Ichimoku Indicator So Important in Market Analysis?
Unlike many common tools in technical analysis, Ichimoku provides the analyst with a much broader range of information. It offers a coherent and complete overview of current market conditions and accurately identifies key support and resistance levels.
One of the main features of Ichimoku is its ability to analyze price movement and direction. This indicator visually and analytically displays market fluctuations and direction, allowing traders to understand both current and future market conditions simply by reviewing the chart.
The signals issued by Ichimoku help traders identify bullish or bearish trends. The use of the Ichimoku Cloud makes it easier to detect medium- to long-term trend directions, enabling more precise decision-making.
Other advantages of this tool include its application in identifying optimal market entry and exit points. Additionally, Ichimoku helps traders determine suitable locations for setting stop-loss orders, which in turn supports more effective risk management.
Complete Guide to the Components of the Ichimoku Indicator
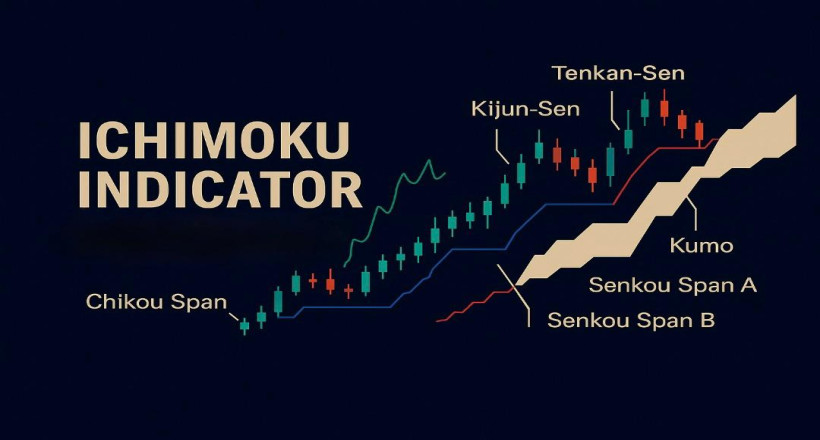
The Ichimoku indicator is composed of several key components, each playing a crucial role in analyzing market structure. These elements, each focusing on different timeframes, provide traders with detailed information about trends, support and resistance levels, and potential price reversal points.
Tenkan-Sen – Conversion Line
Tenkan-Sen is the first component of the Ichimoku indicator and is typically displayed as a red line on the chart. It calculates the average of the highest and lowest prices over the last 9 periods and serves as a tool for identifying short-term market trends.
An upward movement of the Tenkan-Sen indicates a strong bullish trend, while a flat movement often suggests a ranging or trendless market.
Formula:
Tenkan-Sen = (Highest high over 9 periods + Lowest low over 9 periods) ÷ 2
Kijun-Sen – Base Line
Kijun-Sen, usually shown in blue, plays an important role in identifying support and resistance levels. It functions similarly to the Tenkan-Sen but calculates the average over the past 26 periods. As a result, its signals are more reliable and long-term.
Kijun-Sen is also used to forecast the future price direction. If the price stabilizes above this line, the prevailing trend is generally considered bullish.
Formula:
Kijun-Sen = (Highest high over 26 periods + Lowest low over 26 periods) ÷ 2
Senkou Span A – Leading Span A
Senkou Span A is one of the two lines that form the Ichimoku Cloud (Kumo). It represents the average of Tenkan-Sen and Kijun-Sen and is plotted 26 periods ahead of the current price. This helps analysts identify potential support and resistance zones in advance.
When the price is above Senkou Span A, it acts as the first level of support. Conversely, when the price is below it, Senkou A serves as initial resistance.
Formula:
Senkou Span A = (Tenkan-Sen + Kijun-Sen) ÷ 2
Senkou Span B – Leading Span B
Senkou Span B is the second line forming the Ichimoku Cloud and is calculated based on the average of the highest high and lowest low over the past 52 periods. Due to this longer time frame, the line often appears flat, making it a key element for identifying strong support and resistance levels.
When the price is above Senkou B, the line acts as a support level. When the price is below it, it acts as resistance.
Formula:
Senkou Span B = (Highest high over 52 periods + Lowest low over 52 periods) ÷ 2
Chikou Span – Lagging Span
Chikou Span is another important component of the Ichimoku indicator, typically shown in green on the chart. It plots the current closing price 26 periods behind, allowing traders to compare current market behavior with past price action.
Trading signals from Chikou Span include:
Ichimoku Cloud (Kumo) – The Visual Core of the Indicator
The Japanese word Kumo means "cloud," and in the Ichimoku system, it refers to the area between Senkou Span A and Senkou Span B. This region is what we call the Ichimoku Cloud, one of the most powerful visual tools in technical analysis.
The combination of these components creates the unique structure of the Ichimoku indicator—each part providing essential information about trends, volatility, and price reversal zones.
Ichimoku Chart Analysis: How to Interpret Chart Data
The charts generated by the Ichimoku indicator offer deep, multi-layered information that requires careful analysis to gain a proper understanding of the market. Each component of the Ichimoku chart can provide clues about the current market condition and the potential future direction of price movement.
Trading Signals in the Ichimoku System
Thanks to its complex and multi-dimensional structure, the Ichimoku indicator is capable of generating various types of trading signals. These signals are generally divided into two main categories:
Momentum Signals
These signals are generated based on the interaction between market price, the Conversion Line (Tenkan-Sen), and the Base Line (Kijun-Sen). Depending on the position of these elements relative to each other, bullish or bearish signals may appear:
Trend-Following Signals
These signals are primarily based on the position of the price in relation to the Ichimoku Cloud (Kumo) as well as the slope and color of the cloud:
Combining these two types of signals helps traders gain a clearer understanding of optimal entry and exit points in the market and adjust their strategies with greater precision.
Identifying Support and Resistance Levels with Ichimoku
One of the key applications of the Ichimoku indicator is its ability to identify major support and resistance zones. These levels are typically determined through the Ichimoku Cloud or lines such as the Chikou Span. In many charts, the Ichimoku Cloud is displayed in green or red, offering insight into buying or selling pressure:
Additionally, the Ichimoku system utilizes a 26-period timeframe for plotting many of its elements. This feature enables traders to forecast potential future price movements by analyzing this period and to identify possible price reversal points.
Trading Strategies Using the Ichimoku Indicator
Due to its multi-dimensional nature, the Ichimoku indicator allows traders to design and implement a variety of trading strategies. Below are some of the most important Ichimoku-based strategies:
1. Tenkan-Sen and Kijun-Sen Cross Strategy
When the Conversion Line (Tenkan-Sen) crosses the Base Line
(Kijun-Sen) from below, it usually signals the start of a bullish trend and may
serve as a buy signal.
Conversely, when Tenkan-Sen crosses Kijun-Sen from above to below, it can be
interpreted as a sell signal.
2. Using the Ichimoku Cloud to Identify Entry/Exit Points
The position of price relative to the cloud (Kumo) is a core part of Ichimoku-based strategies:
3. Trend Confirmation with Chikou Span
The Chikou Span, which plots the current price shifted back
26 periods, can be used as a confirmation tool alongside other lines.
If the Chikou Span is above the price chart, it is generally considered a
confirmation of a bullish trend continuation.
4. Combining Ichimoku with Other Indicators
Using Ichimoku in combination with tools like RSI or MACD
can improve signal accuracy and help identify better entry and exit points.
This is especially useful in highly volatile markets like cryptocurrencies,
where signal confirmation through additional indicators is crucial.
Advantages of Using the Ichimoku Indicator in Technical Analysis
Ichimoku is not just a simple indicator—it’s a comprehensive trading system with many benefits for both professional and novice traders:
1. Provides a Complete Market View at a Glance
As its full name Ichimoku Kinko Hyo (meaning “equilibrium chart at a glance”) suggests, this tool allows analysts to instantly gather critical market information.
2. Combines Multiple Tools in One Indicator
Ichimoku integrates moving averages, trend lines, support and resistance tools, and momentum confirmations. This reduces the need to add multiple separate indicators to your chart.
3. Accurately Identifies Support and Resistance Levels
The Ichimoku Cloud visually highlights areas where price reversals or breakouts are more likely to occur. This feature is especially helpful for setting stop-loss or profit target levels.
4. Usable Across All Timeframes and Markets
Ichimoku isn’t limited to one market. From stocks and forex to cryptocurrencies, this indicator can be applied across all charts and timeframes.
5. Multi-layered and Precise Signaling
The combination of Tenkan, Kijun, Chikou, and the Kumo Cloud generates multiple signals that complement one another and give the analyst a well-rounded perspective on market behavior.
Conclusion
Ichimoku is far more than a simple price-tracking tool; it’s
a comprehensive analytical system that can meet all the needs of a professional
trader within a single chart.
With its various lines—Tenkan-Sen, Kijun-Sen, Chikou Span, Senkou A & B—and
the Kumo Cloud, traders can simultaneously assess trend direction, trend
strength, support and resistance levels, and optimal entry and exit points.
This tool performs especially well in volatile markets like cryptocurrencies. Although it may seem complex at first, with careful learning and practice, Ichimoku can become one of the foundational tools of your technical analysis.


