
In the world of technical analysis, various tools are used to analyze price movements and make informed trading decisions. Indicators play a key role in this process and are often used to identify trends, momentum strength, or overbought and oversold conditions. Among these tools, the ATR indicator (short for Average True Range) holds a unique position.
Unlike many other indicators that focus on the direction of price movement, the ATR is specifically designed to measure the level of market volatility. Although this indicator does not directly provide buy or sell signals, proper use of it can significantly improve the timing of entries and exits, help set stop-loss levels, and identify highly volatile conditions in the market. In this article, we will fully explore the concept of ATR, understand how it is calculated, and learn how to use it effectively in trading to make more precise decisions.
What Is the ATR Indicator and What Is It Used For?
Among the many analytical tools used in financial markets, some—such as RSI, Fibonacci, and ATR—are especially popular. The ATR indicator, which stands for Average True Range, is a specialized tool for measuring price volatility over a specified period.
This indicator was first introduced by renowned analyst J. Welles Wilder in his book New Concepts in Technical Trading Systems. Unlike many other tools that are designed to detect price direction, ATR focuses solely on assessing the intensity of market fluctuations.
When price movements become more intense, the ATR value rises, and its chart trend moves upward. Conversely, when the market becomes calmer and less volatile, the ATR decreases, and the chart begins to slope downward.
ATR is typically calculated using a 14-period average, which can be based on daily, weekly, or even hourly time frames. Traders can adjust this period depending on their individual strategies. The shorter the time frame, the more sensitive the ATR becomes to price fluctuations.
It’s important to note that ATR only measures volatility and does not provide any indication of trend direction. One common mistake among traders is interpreting a decrease in ATR as a sign of a downtrend, while in reality, it simply reflects a reduction in market volatility—not necessarily a price decline.
How Is the ATR Indicator Calculated?
While it’s not necessary to calculate ATR manually—since most charting platforms do it automatically—understanding its formula can provide deeper insight into how the indicator functions.
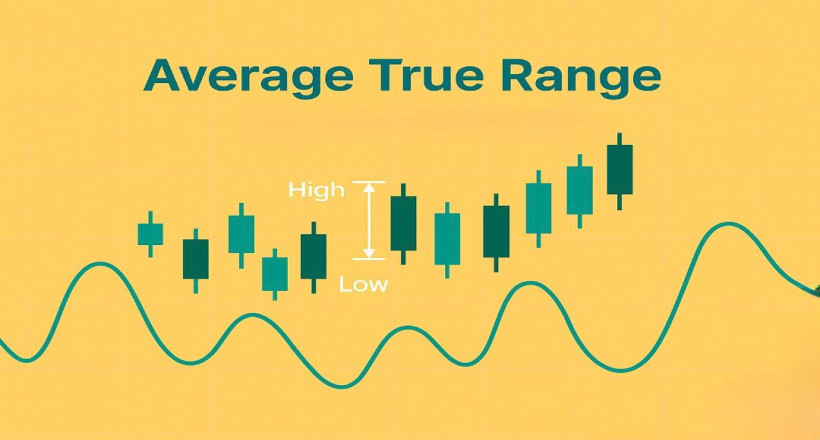
The ATR is designed to measure market volatility over a selected time frame. To calculate it, one of the following three values is considered based on candlestick position on the chart. The highest among these three is taken as the True Range (TR):
From each candle, the largest of the above three values is chosen as the True Range. Then, the ATR value is calculated by averaging these values—typically over 14 periods.
How Is the ATR Indicator Calculated?
Although the ATR (Average True Range) indicator is calculated automatically by most trading platforms, understanding its formula can help traders better interpret its behavior under various market conditions.
The ATR is based on the largest value obtained from three possible volatility calculations for each candlestick. These three methods are:
From these three values, the maximum is selected as the True Range (TR) for that period.
For example:
Initial ATR Calculation
To calculate ATR, you must first compute the TR for a certain number of periods (typically 14). Then, sum these TR values and divide by the number of periods.
Formula:
ATR(14) = (TR1 + TR2 + ... + TR14) / 14
True Range (TR) Formula
This is the mathematical representation of the True Range:
TR = Max of the following:
1. High - Low
2. |High - Close_prev|
3. |Low - Close_prev|
Where:
Note: TR values are raw and not averaged yet. Once calculated over multiple periods, their average becomes the ATR.
ATR Calculation for Later Periods
From the 15th period onward, new ATR values are computed using the previous ATR and the TR of the latest candle, using this formula:
ATR(15) = [(ATR(14) × 14) + TR(15)] / 15
This formula shows that ATR is essentially a smoothed moving average of the True Range values and updates with each new candle. The ATR is typically displayed as a line chart beneath the main price chart in technical analysis platforms.
Analyzing the Role of the ATR Indicator in Identifying Market Volatility
The ATR (Average True Range) indicator performs exceptionally well in markets known for high volatility—such as the cryptocurrency market. When the price of an asset fluctuates within a wide range, it signals significant price turbulence. However, it's important to distinguish between volatility and momentum.
Momentum refers to the strength of price movement in a particular direction. For instance, if the market rapidly drops with long red candles, it reflects strong downward momentum. On the other hand, when long green and red candles appear alternately and price swings unpredictably between up and down, the market is considered volatile but directionless. In such conditions, traders use the ATR indicator to better understand market behavior and identify potential trading opportunities.
This raises the question: How can the ATR indicator help identify the probable direction of future price movement and enable more precise trading decisions?
In reality, market volatility naturally fluctuates over time—periods of calm are often followed by volatile phases. Professional traders leverage this cyclical behavior using a specific three-step strategy:
This method is popular for entering trades at the start of a high-volatility phase. Experience shows that periods of low volatility are often followed by sharp price movements, presenting profit opportunities.
Strengths and Weaknesses of the ATR Indicator in Technical Analysis
Indicators have always been essential tools for technical analysts to interpret market conditions. ATR is among the most widely used tools for assessing price volatility and offers several significant advantages. However, like any analytical tool, it also has its limitations.
Advantages of the ATR Indicator
Disadvantages of the ATR Indicator
Conclusion
The ATR indicator is one of the most practical tools in technical analysis for assessing market volatility. While it doesn't provide directional signals, it offers valuable insights into market behavior by tracking the range of price movements.
By understanding the logic behind its calculation, traders can combine ATR with other tools such as trendlines, momentum indicators, and support/resistance levels to make more informed decisions. Though ATR alone isn't a buy or sell signal generator, it plays a crucial role in risk management, identifying volatile phases, and choosing optimal entry points.
Ultimately, the effectiveness of ATR depends on the trader’s experience, market understanding, and analytical skills. For best results, it is recommended to use ATR in conjunction with other indicators to maximize its potential.


