
For effective participation in the cryptocurrency market and achieving successful trades, having sufficient knowledge and a proper understanding of market behavior is of great importance. Professional traders and analysts in this field evaluate the price action of assets using various tools. Although there are many platforms and websites for analyzing markets and assets, what matters most is your personal ability to analyze and make use of this information.
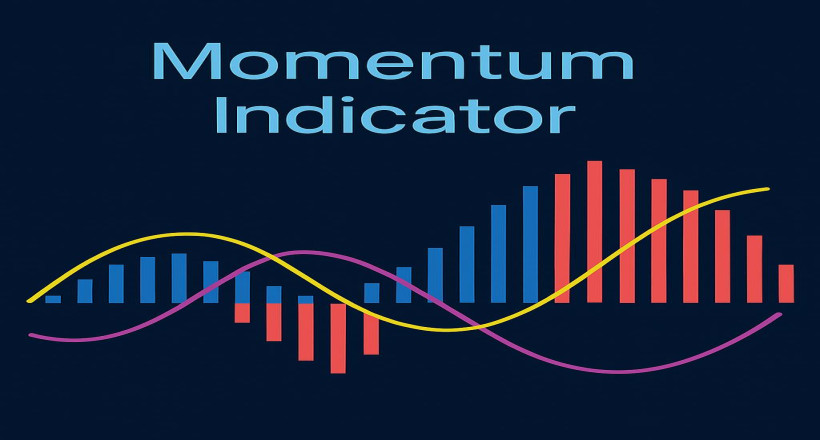
One of the practical tools used in technical analysis of cryptocurrencies is the Momentum Indicator. This indicator allows you to assess the strength or weakness of a price trend of a cryptocurrency over different time frames and to measure the speed of price movement. With the help of the momentum indicator, you can identify trend changes and take timely action — whether it’s buying during bullish conditions or making decisions in bearish situations. In this article, we will explore the momentum indicator and its applications so that you can take advantage of this powerful tool in your trading decisions.
Getting to Know the Momentum Indicator
A successful trader should always be aware of the direction in which their targeted asset is moving. This means being able to predict whether the price of that asset is likely to continue its current path or if there is a chance it might reverse. In this regard, an indicator like momentum is a suitable tool that can provide valuable insights into the driving force behind price movements, giving traders a clearer view of the market’s dynamics.
The momentum indicator is one of the widely used tools in technical analysis that helps gauge the strength or weakness of a price trend. Interestingly, over time, traders have more often utilized this indicator during bullish periods. The reason is that growth phases — or bull markets — typically last longer than bearish phases and provide more opportunities for analysts.
To better understand the concept of the momentum indicator, it is useful to know that indicators are essentially tools designed to simplify and interpret mathematical formulas that are plotted as lines on a price chart. The Momentum indicator, sometimes abbreviated as MOM, is a leading indicator that compares the current price with a past price, thereby allowing traders to assess how much the value of an asset has increased or decreased. This characteristic makes momentum one of the key elements of technical analysis in the crypto market.
Applications of the Momentum Indicator in Cryptocurrency Market Analysis
The cryptocurrency market is always filled with challenges and uncertainties that traders and investors seek to clarify using various tools. The momentum indicator is one of the most practical tools in technical analysis that gives traders a clearer understanding of price trends and the future of digital assets. There are multiple ways to use this indicator in trading, and becoming familiar with them can lead to better trading decisions.
Divergence
One key concept associated with the use of the momentum indicator is divergence. This occurs in two forms: bullish and bearish. For example, if the price of an asset is in a downtrend but the momentum indicator starts rising from its lowest points, this is known as bullish divergence. Such a pattern indicates weakening selling pressure and a possible end to the downtrend. Therefore, if a buy signal appears, this divergence can serve as confirmation.
Conversely, when the price of an asset is rising but the momentum indicator shows lower highs, you are witnessing a bearish divergence. This situation may warn of decreasing buyer strength and a potential price reversal. Thus, if sell signals are detected, this divergence can act as a confirmation.
Riding the Trend
Another way to use the momentum indicator is by analyzing the behavior of its trend line. This approach enables you to better understand the price changes of an asset. For instance, if the momentum line hits its lowest level and then reverses and starts moving upward, it could be a sign of a return of strength to the market and a potential price increase.
Trading Extremes
One of the important applications of this indicator is identifying maximum and minimum price levels. In this strategy, the trader aims to buy at the lowest price level and sell at the highest. This approach becomes more effective when momentum is combined with other complementary indicators for more precise market analysis, thereby reducing the risk of decision-making.
Types of Momentum Indicators and Their Applications
To evaluate the momentum and speed of an asset’s price movement in financial markets, it is recommended to use multiple indicators simultaneously to achieve more accurate and reliable analyses. There are various tools available to traders and analysts for this purpose, with the most important ones including:
The MACD consists of two main components: the signal line and the MACD line. When the MACD line crosses above the signal line, it generates a buy signal. Conversely, when it crosses below the signal line, it generates a sell signal. The Rate of Change (ROC) measures the rate at which an asset’s price changes compared to the past. A positive ROC usually indicates an upward price trend and generates a buy signal.
Here are three of the most widely used momentum indicators:
Stochastic Oscillator
The Stochastic Oscillator is a common tool for comparing the closing price of an asset over specific time periods. It tracks price fluctuations regardless of trading volume and is useful for identifying overbought and oversold conditions. Its value ranges from 0 to 100. When the indicator shows a value above 80, the asset is considered overbought; when it shows a value below 20, the asset is considered oversold.
Relative Strength Index (RSI)
The RSI is used to examine the speed and magnitude of price changes in a given time frame. Like the Stochastic Oscillator, it displays a value between 0 and 100, helping traders assess the strength of a trend.
Average Directional Index (ADX)
The ADX measures both the strength and direction of an asset’s price movement. When the ADX value is 20 or above, it indicates that a trend exists in the market. A value below 20 suggests the market is in a ranging or neutral state.
Advantages and Disadvantages of the Momentum Indicator
Advantages:
The momentum indicator enables analysts to examine the strength of price
changes over different time frames. Importantly, it measures the force of price
movements regardless of direction (whether upward or downward).
Another key advantage of momentum is its ability to help identify potential reversal points. When a divergence forms between price movement and the momentum indicator, the likelihood of a trend reversal increases, offering valuable insights for traders.
However, momentum does not specify the exact direction of price movements, so it is best used alongside other tools like trendlines or moving averages to achieve a more comprehensive analysis of price action.
Disadvantages:
One limitation of the momentum indicator is that it does not provide much
additional information beyond what is visible on the price chart itself. Its
changes are most noticeable when the price is undergoing strong bullish or
bearish trends.
Additionally, traders should ideally wait for momentum signals (such as crossing a key level or resistance) to be confirmed before entering a trade. This may result in slight delays in decision-making.
Conclusion
In technical analysis, the ability to correctly interpret charts plays a crucial role in achieving trading success. Understanding price behavior allows traders to make smarter, more informed decisions. When the direction of price movement is clear, one can enter trades aligned with that trend. The Momentum Indicator is a practical tool for measuring the speed and strength of price movements in the market.
Generally, prices tend to continue in their current direction unless an opposing force from buyers or sellers emerges to change that path. Using the momentum indicator helps identify key levels and zones in the market, allowing traders to align with the dominant market direction and make better trading decisions.

