
Elliott Waves are considered one of the key tools in technical analysis of financial markets. Traders use this theory and its patterns to try to forecast the probable future trend of prices. However, it is important to note that not only Elliott Waves but no analytical theory can provide completely accurate, error-free predictions, as financial markets are inherently volatile and uncertain.
In this article, we will first introduce the concept of Elliott Waves, and then explore how to analyze and identify them in market charts. The goal is that through continuous study and practice, you will be able to correctly recognize this pattern and apply it in your trading decisions.
Elliott Wave Theory
The Elliott Wave Theory is based on the idea that market movements occur in specific, repetitive patterns. This pattern typically consists of five waves, three of which are motive waves moving in the direction of the primary trend, while the other two are corrective waves moving against the main trend. This structure helps analysts examine price cycles and gain a relative outlook on the future path of the stock or cryptocurrency market, as well as assess the risk-to-reward ratio.
The roots of this theory can be traced back to the teachings of the Dow Theory. According to Dow, all price movements in the market follow a set of rules and structured patterns. At first glance, market fluctuations may seem completely random, but in reality, these changes follow consistent and repeatable patterns. Investors and traders use these patterns along with other tools, such as indicators, to conduct their analyses. However, it should be emphasized that Elliott Waves are not a technical indicator in the conventional sense, but rather a theoretical framework for predicting probable market movements.
History of the Elliott Wave Theory
Ralph Nelson Elliott, the founder of the wave theory, turned his focus to studying stock market behavior at the age of 58 after being forced into retirement due to illness. With remarkable attention to detail, he collected and analyzed 75 years of market data across annual, monthly, weekly, daily, and even hourly timeframes.
The results of his research took shape in November 1934 as a new idea about market movements, later known as the “Wave Principle.” Elliott shared this concept with Charles J. Collins, an investment advisor in Detroit. After months of collaboration and joint research, they co-authored the book The Wave Principle, which was finally published on August 31, 1938.
Elliott did not stop his studies after the book’s publication. In the early 1940s, he expanded his theory and discovered the connection between wave structures and the golden Fibonacci ratios. Today, this theory is widely used by analysts and traders, with many investors incorporating it into their daily trading analyses and decisions.
Types of Waves in Elliott Theory
1. Motive Waves
Motive waves always move in the direction of the main market trend and are generally divided into two structures: impulse and diagonal. These waves are usually longer and stronger than corrective waves, driving the most significant price movements.
2. Corrective Waves
In contrast to motive waves, corrective waves move against the main trend. Identifying these waves is more challenging and requires careful observation and experience. Corrective waves are usually labeled as A, B, and C, and their three common structures include flat, triangle, and zigzag patterns.
The Importance of Identifying Wave Types
Mastering the identification of these waves plays a crucial role in trading success. The challenging part is recognizing the type of wave at the early stages of its formation, as trading decisions change based on this knowledge. Typically, motive waves exhibit larger movements, while corrective waves are smaller and primarily serve to prepare the market for the next move.
Many traders focus on the end of a corrective wave to prepare for entry into the next motive wave. This point often presents an attractive, lower price for entering a trade. Once the motive wave begins, the price tends to rise quickly, offering the opportunity for significant profits. For this reason, the end of corrective waves is often considered the best time to enter the market.
The Five Main Elliott Wave Patterns
As mentioned earlier, in Elliott Wave Theory there are two types of motive waves and three types of corrective waves, forming a total of five main patterns. Below, we introduce each of these patterns and review their characteristics.
1. Impulse Pattern
The impulse is the most common and, at the same time, the simplest type of motive wave in financial markets. This structure consists of five sub-waves, including three motive waves and two corrective waves. To identify an impulse wave, certain rules must be observed, and if any of them are violated, the structure is not considered an impulse:
To confirm whether a wave is an impulse, simply number it and compare it with these rules on the chart.
2. Diagonal Pattern
The diagonal is another type of motive wave, more complex in structure compared to the impulse. This wave also consists of five sub-waves and is divided into two categories: leading diagonal and ending diagonal. In a leading diagonal, sub-wave 1 is an impulse, while in an ending diagonal, sub-wave 5 has an impulse structure.
3. Zigzag Pattern
A zigzag is a corrective wave composed of three sub-waves labeled A, B, and C. In this pattern, Waves A and C are motive, while Wave B is corrective. Zigzags often move strongly upward or downward and are frequently used to correct a significant portion of the previous impulse wave. This pattern can also appear in combination, where two or three zigzags are connected by a corrective wave.
4. Flat Pattern
Another corrective structure is the flat pattern, which also consists of three waves labeled A, B, and C. The main difference from the zigzag is that Wave B usually retraces a larger portion of Wave A. This pattern is more common in low-volatility markets or when the market is in a consolidation phase.
5. Triangle Pattern
Triangle waves are made up of five sub-waves labeled A, B, C, D, and E. At first glance, this pattern seems simple, but accurately identifying it on a chart requires experience and practice. Triangles typically appear at the final stage of a large move and indicate price compression before the next movement.
Different Degrees of Elliott Waves
In Elliott Wave Theory, market movements are organized in a structured and
hierarchical manner, with each wave belonging to a specific degree. These
degrees, from the largest to the smallest, are as follows:
The nature of Elliott Waves is fractal, meaning each wave can repeat on a larger or smaller scale. Therefore, in real charts, the size of these degrees might slightly differ from their textbook definitions.
To apply this theory in trading, traders usually first identify an upward impulse wave on the chart. At this stage, they enter a long position, and after the completion of the five sub-waves of this structure, when the corrective wave begins, they open a short position. This cycle allows the trader to maximize profits from trend reversals.
The size of each wave in Elliott Waves depends on the length and ratio of previous waves and may change over time. This fractal characteristic causes wave structures to rearrange as new waves form over time.
Elliott Wave Theory is useful for both short-term analyses and long-term strategies and can be a relatively precise tool for predicting the probable future direction of the market.
How to Identify and Analyze Elliott Waves
After becoming familiar with the types of Elliott Waves and their sub-waves, we
can now examine the method of recognizing and interpreting these waves in the
stock market with the help of a visual example.
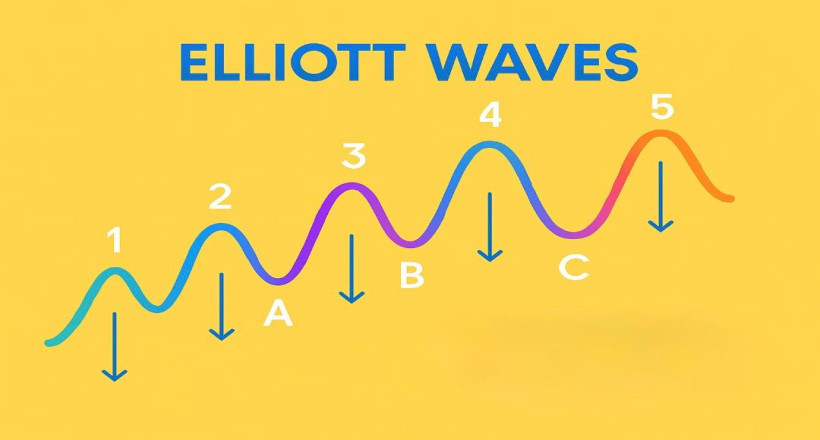
In the image, a pattern consisting of 8 waves is visible; 5 of these are motive (impulse) waves numbered 1 through 5, and the other 3 are corrective waves labeled A, B, and C. Impulse waves move in the direction of the main market trend, with waves 1, 3, and 5 moving along the trend, and waves 2 and 4 moving against it.
Corrective waves generally consist of three parts: waves A and C move in the direction of the correction, while wave B moves against them.
In this example, a complete Elliott cycle composed of an impulse wave and a corrective wave is shown, representing a combination of positive and negative market movements. Traders analyze these movements to forecast future market behavior.
A key point is that one should not assume every impulse wave is necessarily upward nor every corrective wave downward. The direction of wave movements depends on market conditions, so it is recommended to study and practice these patterns on various charts for better understanding.
Indicators Related to Elliott Waves
To identify and analyze Elliott Waves more accurately, using supporting indicators
and tools can enhance predictive precision. These indicators help traders
better recognize the start, end, and strength of each wave. Below are the most
important indicators related to Elliott Waves:
Using these indicators alongside Elliott Wave rules strengthens a trader’s analytical view and helps avoid emotional decisions.
Conclusion
Elliott Waves are a powerful tool in technical analysis that enable the
identification of recurring price movement patterns, facilitating the
prediction of future market trends. The combination of motive and corrective
waves forms the core structure of market movements, allowing traders to
identify optimal entry and exit points.
By employing supporting indicators such as Fibonacci, RSI, MACD, volume, moving averages, and candlestick patterns, the accuracy of wave analysis improves and trend reversal points can be recognized faster.
Remember, Elliott Waves are not a 100% certain system but an analytical tool that requires practice, experience, and use alongside other instruments. Combining wave counting knowledge with reliable indicators can provide a comprehensive understanding of market behavior and increase the likelihood of trading success.


