
Understanding the MACD Indicator: A Key Tool for Trend Analysis
The MACD indicator (Moving Average Convergence Divergence) is one of the most popular tools in technical analysis, widely used by traders to identify potential trend reversals in the market. By analyzing the distance and interaction between two exponential moving averages, this indicator helps analysts determine optimal entry and exit points in trading.
Given MACD’s widespread applications in analyzing price movements, this article provides a comprehensive overview of the tool, how it works, and the different versions of the MACD indicator—empowering traders to use it effectively in their strategies.
What Is the MACD Indicator and What Is Its Background?
The MACD, short for Moving Average Convergence Divergence, is a widely used technical analysis tool that plays a crucial role in identifying price trends—an essential factor in successful trading. It belongs to the momentum indicator family and assists traders in evaluating the strength or weakness of a market trend, enabling smarter decisions on buying and selling.
This analytical tool was developed in the 1970s by Gerald Appel, a physicist and financial analyst from the United States. With years of experience in investment advising and market research, Appel introduced MACD as a practical solution for analyzing market momentum. He is also the author or co-author of more than 15 influential books on financial markets.
Later on, Thomas Aspray added a new feature to this indicator—the MACD Histogram—which provided more precision in identifying trading signals and further enhanced decision-making capabilities.
Key Applications of the MACD Indicator in Technical Analysis
The MACD indicator has become a favorite among traders in various markets, particularly in stocks and cryptocurrencies, thanks to its high accuracy and versatility. Below are some of the most important uses of MACD:
Reliable Trade Signals
In trading, the accuracy of signals is vital, as major investment decisions rely on them. MACD uses moving averages to generate simple yet reliable signals, making it an effective guide for identifying potential entry and exit points in the market.
Trend Analysis and Strength Evaluation
Identifying the direction of a trend alone is not enough; understanding the strength behind it is equally important. The MACD Histogram displays this information clearly, indicating whether a trend is gaining or losing momentum—crucial for traders seeking high-return opportunities.
Reflecting Real-Time Market Conditions
One of MACD’s valuable traits is its ability to deliver up-to-date insights into the current market situation. This enables traders to make decisions based on actual market behavior rather than assumptions or outdated data.
Compatibility with Multiple Timeframes
Traders operate using different timeframes depending on their strategies. MACD stands out for its adaptability, performing well across all timeframes—whether short-term scalping or long-term swing trading—providing relevant signals for each.
Easy to Read and Interpret
Another major advantage of MACD is its ease of use. Its signals are straightforward, making it accessible even to beginners. With minimal training, new traders can quickly learn to interpret MACD signals and integrate them into their trading strategies.
Analyzing Recent Price Movements
When it comes to assessing short-term price volatility, MACD proves to be an effective tool. By comparing EMAs with different periods, it helps traders visualize recent price changes clearly and accurately.
Key Components of the MACD Indicator You Should Know
The MACD indicator consists of several elements, and understanding how each part functions is essential for using this technical analysis tool effectively. Below, we explore the three core components that shape this powerful indicator:
MACD Line
The MACD line plays a central role in this indicator. It is calculated by subtracting the 26-period Exponential Moving Average (EMA) from the 12-period EMA. This line reflects the speed and strength of a price trend in the market. Due to its responsiveness to price fluctuations, the MACD line often appears highly dynamic and is typically displayed in blue—although its color can be customized by the user.
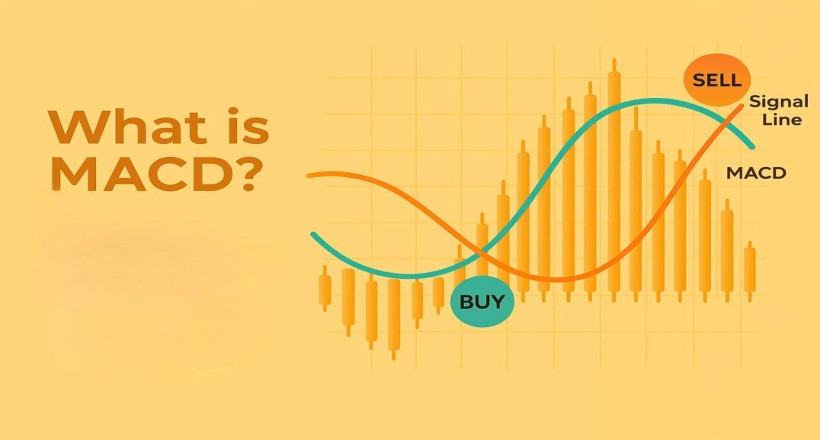
Signal Line
The signal line is a smoother version of the MACD line. It is generated by applying a 9-period EMA to the MACD values. As it reacts more slowly to price changes, this line is commonly used to identify potential trend reversals. By default, the signal line is shown in red.
Histogram
The MACD histogram consists of vertical bars that visually display the difference between the MACD and signal lines. When the gap between these two lines widens, the bars grow longer, and when the gap narrows, the bars shrink. The histogram oscillates around a central axis known as the zero line, helping traders assess market momentum and divergence signals more clearly.
Note: The colors of the MACD line, signal line, and histogram are fully customizable. The colors mentioned above are standard defaults, but users can modify them according to their platform or personal preferences.
How to Calculate the MACD Indicator
MACD comprises three key elements: the MACD Line, the Signal Line, and the Histogram. Here's how each component is calculated:
All of these components oscillate around a central axis called the Zero Line or Center Line, which helps determine the prevailing market direction—whether bullish or bearish.
Types of MACD Indicator: Classic vs. Modern Version
The MACD indicator is available in two main formats: the Classic (Old) version and the Modern (New) version. While both versions operate on the same underlying principles, they differ in how they visually represent data.
Classic MACD
The classic version displays three main components:
This version clearly illustrates the divergence and convergence of the two lines, allowing traders to spot crossovers and momentum shifts more easily.
Modern MACD
The modern version still includes the histogram (often in black or gray) and the red signal line. However, unlike the classic version, it typically omits the separate display of the MACD line. Instead, it focuses more on the volume and momentum dynamics of the market, making it a visually simpler option for traders who prefer a less cluttered interface.
Trading Signals from the MACD Indicator
Crossover Signals
Zero Line Crossovers
Histogram Analysis
Divergence Signals in MACD
Regular Divergence
Hidden Divergence
Divergences are powerful tools for spotting trade opportunities against the current market direction, especially when they appear near key support or resistance zones.
How to Interpret the MACD Indicator: A Practical Guide for Traders
The primary purpose of the MACD indicator is to reveal convergence and divergence between two Exponential Moving Averages (EMAs). Recognizing these patterns helps traders better assess the direction and strength of a market trend.
In standard MACD settings, the 12-period EMA (faster) and the 26-period EMA (slower) are used. The 12-period EMA reacts more quickly to price changes, while the 26-period EMA reflects longer-term trends and filters out noise.
MACD movements occur around the Zero Line, also known as the centerline:
In essence, proper interpretation of MACD based on crossovers and positioning relative to the zero line can serve as a reliable method for identifying entry and exit points—particularly in crypto markets.
Conclusion
The MACD indicator is a versatile and powerful tool for cryptocurrency traders. While it does require precision and practice, combining MACD with other analytical methods can significantly boost trading success.
If you're looking for a tool that highlights both trend direction and momentum, and also offers reliable entry and exit signals, MACD is undoubtedly one of the top choices.


