
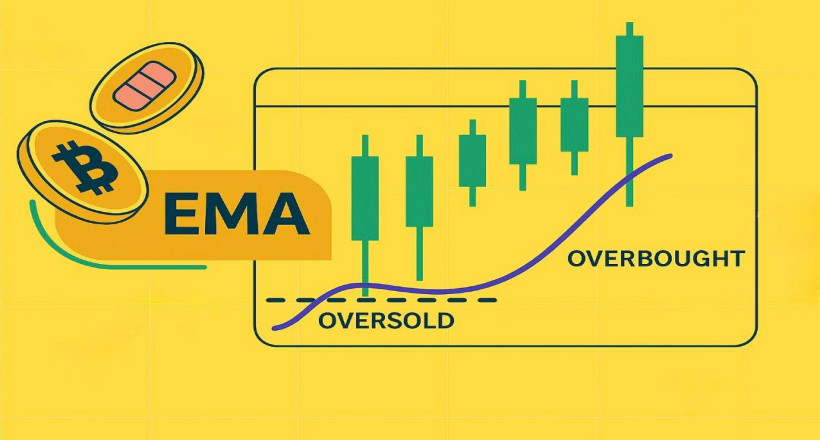
The EMA indicator, or Exponential Moving Average, is one of the most important tools in technical analysis, especially in the cryptocurrency market. This indicator responds more quickly to price changes, helping traders identify market trends more accurately and make timely decisions. In this comprehensive and professional article, you will learn all about the EMA, its applications, and how to use it correctly in trading.
What Is the EMA Indicator?
EMA stands for Exponential Moving Average. Unlike the simpler version called the SMA (Simple Moving Average), the EMA puts greater emphasis on recent prices, making it faster and more accurate in tracking price fluctuations.
In fact, the EMA gives more weight to the latest data points in its calculation, which allows it to reflect price changes more quickly on the chart. This characteristic makes the EMA particularly useful for short-term strategies, scalping, and day trading.
What Is the Difference Between EMA and SMA?
To better understand how the EMA works, it's essential to know how it differs from the Simple Moving Average (SMA). While the SMA gives equal weight to all previous prices within a specific time period, the EMA focuses more on recent data.
As a result, the EMA reacts faster to price changes compared to the SMA. This makes the EMA provide earlier signals during volatile market conditions. However, it’s important to note that this feature can sometimes generate false signals during sideways or non-trending market phases.
How to Calculate the EMA
To calculate the EMA, you first need to determine a multiplier using the following formula:
Multiplier = 2 ÷ (Time Period + 1)
Then the EMA is calculated using this formula:
EMA = (Current Price - Previous EMA) × Multiplier + Previous EMA
This formula allows the EMA to prioritize recent prices more heavily than older data, making it more responsive to market movements.
Applications of the EMA in Technical Analysis
One of the main reasons for the EMA's popularity is its wide range of applications in trend analysis. Below are the key ways traders use the EMA:
1. Identifying Trend Direction
If the price of an asset is above the EMA line, it usually indicates an uptrend. Conversely, if the price is below the EMA, the market is likely in a downtrend. This helps traders avoid trading against the overall market direction.
2. Acting as Dynamic Support and Resistance
The EMA line can serve as a dynamic support or resistance level. Many traders consider price interaction with the EMA as a potential entry or exit point.
3. Generating Buy and Sell Signals
A key use of the EMA is for generating trade signals. For example, when a short-term EMA such as EMA 9 crosses above a longer-term EMA like EMA 21, it generates a buy signal. If the short-term EMA crosses below the long-term EMA, it is interpreted as a sell signal.
Best EMA Settings for the Cryptocurrency Market
Depending on the trading time frame, different EMA periods can be applied:
In many trading strategies, the 200 EMA is considered a strong indicator for determining the long-term market trend.
Combining the EMA Indicator with Other Technical Tools
To improve analysis accuracy and avoid false signals, EMA is often combined with other technical indicators. Some of the most common tools include:
MACD Indicator
The MACD (Moving Average Convergence Divergence) is derived from the difference between two EMAs (typically 12 and 26). It is one of the most powerful tools for assessing trend strength and identifying market reversal points.
RSI Indicator
Combining EMA with the Relative Strength Index (RSI) helps traders identify overbought and oversold conditions alongside the trend direction, enhancing decision-making during volatile market phases.
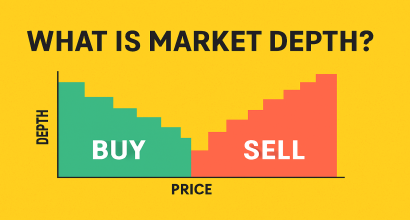
Trading Volume
If the price breaks above or below the EMA line with strong volume, the probability of a true trend reversal increases. Therefore, volume can add confirmation and reliability to EMA signals.
EMA-Based Trading Strategies
One of the most popular methods of using EMA in cryptocurrency trading is the moving average crossover strategy. In this approach, two EMAs with different time periods are used:
For example, combinations like EMA 9 & EMA 21 or EMA 12 & EMA 26 are widely used by traders.
Advantages and Disadvantages of the EMA Indicator
Advantages:
Disadvantages:
Key Tips for Using EMA in Crypto Trading
Conclusion
The Exponential Moving Average (EMA) is a powerful tool in technical analysis, widely used by crypto traders due to its quick responsiveness to price movements. EMA helps traders accurately identify market trends, dynamic support and resistance levels, and potential entry/exit points.
However, for more precise and reliable analysis, it's best to use EMA in combination with other technical indicators.
If you're aiming to improve your performance in the crypto market, mastering the EMA indicator is one of the most valuable steps you can take.

