
Technical analysis is one of the most popular methods for analyzing financial markets, especially the cryptocurrency market. By learning this method, investors can gain a more comprehensive view of price fluctuations and make better decisions. One of the fundamental concepts in technical analysis is the candlestick chart and its associated patterns. If you have paid attention to candlestick charts, you may have noticed the presence of various patterns, each of which can convey a message about past, present, and even future price movements.
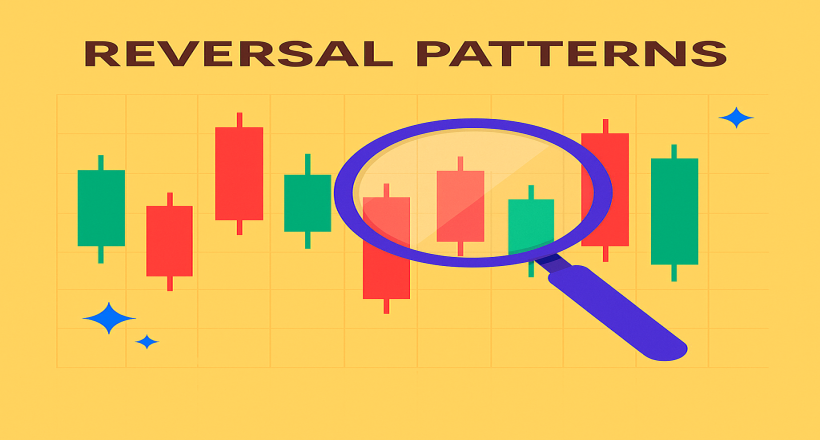
The arrangement of candles sometimes forms specific patterns that are usually considered signals for price trend reversals. Generally, these patterns are divided into two main categories: continuation patterns and reversal patterns. In this article, we aim to introduce reversal patterns — patterns that indicate a potential reversal in price and a change in the current market trend. These patterns help traders identify key points for entering or exiting trades.
What Are Candlesticks, and How Are They Used in Technical Analysis?
One of the most important concepts in technical analysis of financial markets is candlestick patterns. These patterns are powerful tools for visualizing price changes and identifying trends in price charts of cryptocurrencies and stocks. Technical analysts use candlestick charts to identify the highest and lowest prices, opening prices, and closing prices of an asset within a specific timeframe.
Candlesticks are typically displayed in two colors: green and red, representing bullish and bearish trends, respectively. Each candlestick consists of two main components: the body and the shadow. The body represents the range between the opening and closing prices, while the shadows indicate price fluctuations within the chosen timeframe. This simple yet powerful structure helps traders identify reversal points, continuation patterns, and potential trend changes.
In financial markets, candlestick charts remain the most popular method of analysis for traders and investors due to the comprehensive and detailed information they provide about price movements. Despite the emergence of line charts and other analytical tools, many professional analysts still prefer to rely on candlestick patterns for identifying pivot points, support and resistance levels, and determining trading strategies.
Definition of Reversal Candlestick Patterns
Reversal candlestick patterns are among the most important tools in technical analysis. Professional traders use these patterns to identify trend reversal points and make better trading decisions.
Understanding and identifying reversal candlestick patterns may seem complicated, but with precise training and sufficient practice, mastering this skill is achievable. These patterns appear when a bullish or bearish trend is nearing its end, indicating a potential trend reversal in the opposite direction. However, this trend change is not guaranteed and should always be confirmed with other technical analysis tools.
Types of Reversal Candlestick Patterns
Reversal patterns are divided into two main categories:
Types of Reversal Patterns and Their Formation Conditions
In this section, we aim to delve deeper into the various types of reversal candlestick patterns and thoroughly explain the conditions for their formation. Our goal is to simplify each reversal pattern for easier understanding. It is important to note that most of these patterns form near key levels such as support and resistance and play a crucial role in technical analysis of cryptocurrency markets.
Hammer Pattern
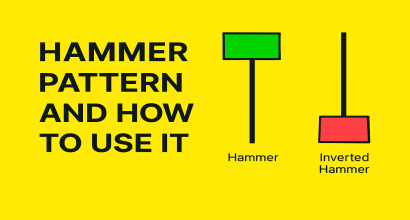
The Hammer pattern is one of the most significant reversal patterns in technical analysis, providing traders with important signals regarding potential price trend reversals. This pattern typically forms at the end of a downtrend and is characterized by a small candlestick with a long lower shadow.
The Hammer indicates a weakening downtrend and the potential beginning of an uptrend. The small body and the long lower shadow suggest that sellers initially pushed the price lower, but eventually, buyers managed to drive the price back up.
In contrast to the Hammer pattern, the Inverted Hammer appears at the end of an uptrend. This pattern has a small body and a long upper shadow, indicating that although buyers initially attempted to push the price higher, sellers ultimately managed to bring the price back down. This situation can serve as a warning of a potential reversal from an uptrend to a downtrend.

Hanging Man Pattern
The Hanging Man pattern is another important reversal pattern in technical analysis that appears at the end of an uptrend. This pattern is very similar to the Hammer pattern; however, unlike the Hammer, which appears at the end of a downtrend, the Hanging Man forms near the top of the chart or around resistance levels.
This candlestick has a small body and a long lower shadow, indicating that buyers attempted to maintain the uptrend but sellers managed to push the price significantly lower, creating a long lower shadow. As a result, this pattern can serve as a warning for the end of an uptrend and the potential beginning of a downtrend.

Belt Hold Patterns (Bullish and Bearish)
The Belt Hold pattern is another crucial reversal pattern in technical analysis that can help traders identify potential trend reversals. This pattern is divided into two types: Bullish Belt Hold and Bearish Belt Hold.

Shooting Star Pattern
The Shooting Star pattern is another single-candlestick reversal pattern in technical analysis that typically forms at the end of an uptrend and can indicate the potential start of a downtrend. This pattern looks very similar to the Inverted Hammer, but it is applicable in different contexts.
A Shooting Star has a small body and a long upper shadow, indicating that buyers initially pushed the price higher, but sellers applied enough pressure to bring the price back to the opening level. A distinguishing feature of this pattern is the absence of a lower shadow or a very short lower shadow, clearly differentiating it from the Inverted Hammer.

Breakaway Patterns (Bullish and Bearish)
The Breakaway pattern is a more complex reversal pattern in technical analysis and is relatively harder to identify compared to single-candlestick patterns like Hammer or Shooting Star. Unlike these single-candle patterns, the Breakaway pattern consists of a series of five connected candlesticks that must be analyzed with greater precision.

Conclusion:
Reversal patterns in technical analysis are valuable tools for identifying potential trend changes. However, the main question is whether these patterns can be fully trusted. The answer is that while reversal patterns help traders identify potential trend reversal points, relying solely on them without further analysis can be risky.
When evaluating the reliability of reversal patterns, two key factors should be considered:
