
One of the most important points to consider when trading cryptocurrencies is accurately analyzing the price trend of the desired crypto asset in the market. Technical analysis is one of the main methods used to study price fluctuations over various time periods. Among these, technical analysis charts play a key role as essential tools in better understanding market behavior.
Since trader behavior in financial markets usually follows recurring patterns, studying these patterns from the past can provide a good perspective on the market’s potential future. This characteristic gives technical analysis particular importance, as it allows analysts to predict possible future market behavior by examining historical data. In this process, different types of technical charts help analysts form a clearer picture of price movements.
Technical Analysis Charts
In crypto technical analysis, the main focus is on price behavior and market movements, rather than the intrinsic or fundamental features of the cryptocurrency. In simpler terms, technical analysis does not concern itself with the project, goals, or backing of a digital asset. Instead, it pays full attention to price trends and trader reactions.
To perform accurate technical analysis on a cryptocurrency, it is essential to pay close attention to price charts and trader behavior patterns. Along this journey, there are important points you will gradually master with experience in trading.
Technical charts are essentially visual tools that display price changes over time. Familiarity with different types of charts—such as candlestick, line, and bar charts—will help you better understand market trends and make more precise trading decisions.
What is a Timeframe?
One of the foundational concepts you need to clearly understand when working with technical analysis charts is the timeframe. A timeframe refers to a specific span of time in which data like the open and close prices, as well as the highest and lowest prices of an asset, are displayed.
For example, if a chart is set to a monthly timeframe, each element of the chart (like a candle or bar) represents the price performance over a full month. Similarly, various timeframes are used to analyze price fluctuations over shorter or longer periods.
Timeframes can vary depending on the type of analysis and trading strategy, and may include:
Each timeframe suits a specific type of analysis. For instance, shorter timeframes are often used by scalpers and day traders, while longer timeframes are more suitable for macro analysis and long-term investments.
Types of Charts in Technical Analysis
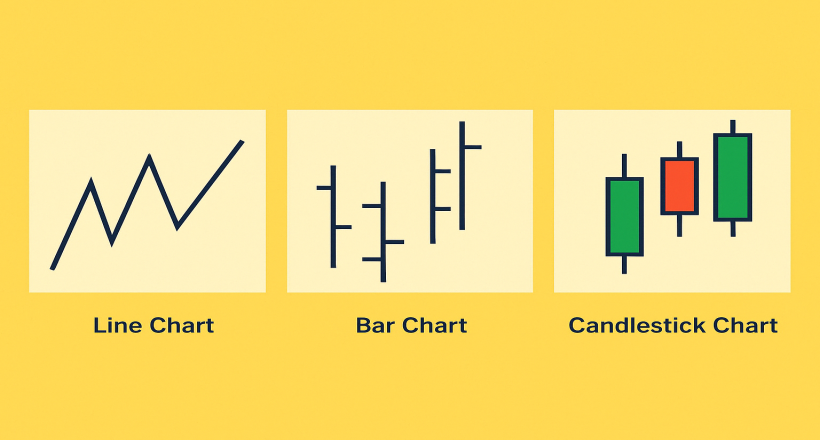
In technical analysis, price charts play a key role in analyzing and predicting market trends. These charts generally fall into two main categories: Line Charts and OHLC Charts. The line chart is considered a separate category due to its simplicity and familiarity, while OHLC charts encompass more detailed formats like the Candlestick Chart and Bar Chart.
Line Chart
A line chart is drawn by connecting points that represent the closing price of an asset over different time intervals. In other words, this type of chart focuses only on the closing price and does not display other data such as the opening price, highest, or lowest prices.
For example, if you want to view the closing price trends of a cryptocurrency over the past few days, a line chart offers a simple and clear picture. However, since it only shows one aspect of the data, you cannot extract details like intraday price fluctuations from it.
The Baseline Chart works in a similar way and usually displays only the closing price. However, unlike OHLC charts, it does not show price fluctuations or the range of movement in each time frame. On the other hand, OHLC charts provide comprehensive data such as the opening, closing, high, and low prices, making them more useful for professional analysts.
Bar Chart
The bar chart is one of the most widely used tools in technical analysis, offering more detailed information than a line chart. It allows you to examine an asset’s price changes within a specific timeframe with greater depth. The four key data points shown in this type of chart are:
Because it displays all four of these key components, this chart falls under the OHLC category.
Each bar represents one time interval and shows price information with a vertical line and two small horizontal lines. The left horizontal line indicates the opening price, while the right one shows the closing price. If the closing price is higher than the opening price, the bar is considered bullish.
In this case, the asset experienced price growth during that timeframe. Conversely, if the closing price is lower than the opening price, the bar is seen as bearish. To enhance clarity, bullish bars are typically shown in green and bearish bars in red, making market trend interpretation easier.
Candlestick Chart
The Candlestick Chart is one of the most commonly used tools in technical analysis and is very popular among cryptocurrency traders. Similar to the bar chart, it shows crucial information like the opening, closing, highest, and lowest prices of an asset. However, its advantage lies in its more intuitive and visually clearer format.
The candlestick consists of two main parts: the body and the wicks (or shadows). The body represents the difference between the opening and closing prices, while the wicks show the price range (high and low) during the selected timeframe. Generally, if the closing price is higher than the opening price, the candle is green (bullish), and if lower, it's red (bearish).
A unique feature of candlestick charts is that the shape and size of each candle can reveal valuable information about market sentiment and trader behavior during a specific timeframe.
Conclusion
To succeed in cryptocurrency trading, having a solid understanding of market behavior and price trends is essential. Technical analysis, as one of the primary methods of studying price movements, provides traders with a variety of tools—the most important being price charts.
In this article, we explored three main types of technical charts: Line Chart, Bar Chart, and Candlestick Chart. We also introduced the important concept of the Timeframe, which plays a key role in accurate analysis based on your trading strategy.
Learning how to use these tools correctly can lead to smarter decision-making in your crypto trading journey.

