
Understanding Candlestick Charts and Their Importance in Technical Analysis
To forecast the future prices of cryptocurrencies or stocks, one of the key tools is analyzing historical price trends over time. These trends are usually presented in various types of charts, allowing analysts to examine market behavior with greater precision. One of the most widely used methods in chart analysis is technical analysis, which plays a vital role in traders' decision-making processes.
In technical analysis, different types of charts are used, such as line charts, bar charts, and candlestick charts. Among these, the Japanese candlestick chart is the most popular among crypto and stock market analysts due to its accuracy and its ability to provide more comprehensive information about price behavior.
To properly understand and use candlestick charts in trading, you need to be familiar with candlestick patterns and basic candlestick literacy. Each candlestick provides essential information, including the opening price, closing price, highest price, and lowest price during a specific time frame. A sequence of these candlesticks can form patterns that help indicate the future direction of the market.
If you're aiming to improve your performance in financial markets like cryptocurrency trading, mastering candlestick patterns is one of the most crucial steps. In the following sections, we'll explore the structure and practical uses of candlestick charts so you can leverage this powerful tool for analyzing crypto price movements.
A Brief History of Candlestick Charts and Their Role in Market Analysis
The use of price charts dates back to the 17th century in Japan when rice traders began using visual tools to analyze price fluctuations. During that time, a well-known rice merchant named Munehisa Homma, from the city of Sakata, developed the early concepts of what we now know as Japanese candlestick charts. Over time, through his trading experiences, his system evolved into a format closely resembling modern candlestick charts.
Eventually, this method of price analysis made its way into Western financial markets. In the early 1900s, Charles Dow, the founder of modern technical analysis, refined and introduced these concepts into the American markets. While the original Japanese version had some differences compared to the Western adaptation, both systems were built on similar core principles.
Some of these principles still hold true in cryptocurrency and other financial markets today:
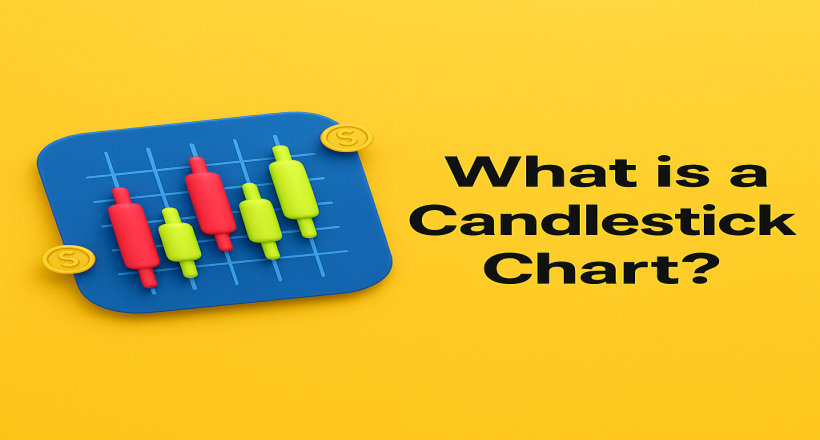
What Is a Candlestick and What Does It Represent in Technical Analysis?
In technical analysis of financial markets — including crypto markets — the candlestick chart is a core tool for observing price behavior. To form a candlestick, we need four data points within a specific time frame: the opening price, closing price, highest price, and lowest price.
Structure of a Candlestick:
Components of a Candlestick Explained
Opening Price
This is the price at which trading begins during a specific time frame.
Closing Price
This is the final price recorded at the end of the time frame.
Highest Price (High)
The upper wick (shadow) of the candle represents the highest price the asset
reached during that time frame. If the closing or opening price equals the
high, the upper shadow will not appear.
Lowest Price (Low)
The lower wick indicates the lowest price during the time frame. If the opening
or closing price is equal to the low, there will be no lower shadow.
What Does the Candlestick Color Indicate?
A candlestick that is still forming will continuously change its shape and color as the price fluctuates. For instance, if the price rises at first, the candle may be green, but if the price later drops below the opening level, the color changes to red.
Price Direction and Candle Range
By examining the candle’s color and its position on the chart, traders can determine the price direction. The range of the candle is the difference between the high and the low, showing how much price fluctuation occurred during the given period.
Interpreting Candlestick Charts in Crypto Technical Analysis
Candlestick charts are among the most widely used tools in technical analysis due to their precise and visual representation of price data. They provide a complete view of an asset’s price behavior over specific time intervals and are easier for traders to read and interpret. Compared to traditional bar charts, candlestick charts are more popular because they clearly display the market trend and the ongoing battle between buyers and sellers.
Candlestick Patterns: The Battle Between Bulls and Bears
Candlestick charts graphically illustrate the tug-of-war between buyers (bulls) and sellers (bears) within a specific time frame. The position of the closing price relative to the high or low can indicate which side was stronger:
The Impact of Candlestick Color and Size
The Role of Shadows in Candlestick Analysis
Combining Candlestick Charts with Analytical Tools
To gain deeper market insights, many traders use oscillators and indicators alongside candlestick charts. These tools analyze candlestick data to detect signals like divergences or signs of trend reversals.
Some indicators are specifically designed to identify candlestick patterns automatically, highlighting key changes on the chart. Validating these signals with candlestick formations can significantly improve the accuracy of technical analysis.
Limitations of Candlestick Charts
While candlestick charts provide critical price data, they have one main limitation: they only show the open, close, high, and low prices of a time frame, but not the sequence in which these prices occurred.
For example, a large bullish candlestick could result from multiple sharp fluctuations, even though it may appear as a smooth upward trend. On lower timeframes, dozens of price movements could lead to the formation of a single candlestick.
Understanding Candlestick Patterns in Technical Analysis
Candlestick patterns are powerful tools in technical analysis that can signal potential trend changes using just one to three candles. These patterns are especially useful in volatile markets like cryptocurrencies and are most effective in short-term timeframes, typically up to four weeks.
A proper understanding of these patterns requires identifying the current market trend. Tools such as trendlines, moving averages, and indicators can assist in this process. Candlestick patterns are often used as a final confirmation before entering or exiting a trade.
Doji Pattern
A Doji forms when the opening and closing prices are nearly equal. It has a very small body, and its upper and lower shadows may vary. The Doji indicates a balance between supply and demand and often reflects market indecision or a possible trend reversal.
The importance of a Doji increases when it appears after large-bodied candles.
Types of Doji:
Star Patterns
Star patterns form when a small candlestick appears gapped from the previous one. Depending on the candle combination, these patterns can warn of trend reversals.
Engulfing Pattern
An Engulfing Pattern occurs when a large candlestick completely engulfs the body of the previous candle.
Harami Pattern
Harami, meaning “pregnant” in Japanese, is formed when a small candle appears within the body of the previous larger candle. This pattern can be either bullish or bearish and indicates market hesitation.
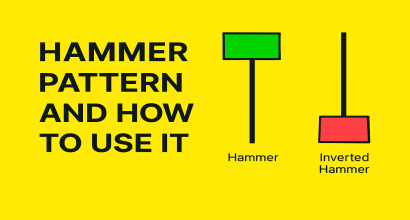
Hammer and Hanging Man
Both have small bodies and long lower shadows:
Shooting Star and Inverted Hammer
Marubozu Pattern
A Marubozu candle has a long body with no shadows, signaling strong control by either buyers (bullish Marubozu) or sellers (bearish Marubozu), and typically confirms the continuation of the current trend.
Spinning Top
A Spinning Top has a small body with long upper and lower shadows, indicating market indecision. It often points to stalling momentum or a weakening trend.
Three White Soldiers
This bullish pattern consists of three consecutive green candles and typically appears at the end of a downtrend, giving a strong buy signal.
Three Black Crows
The opposite of the Three White Soldiers, this pattern includes three consecutive red candles that form at the end of an uptrend and signal a bearish reversal. It’s best to confirm this pattern using indicators like RSI.
Conclusion
Candlestick charts are among the simplest yet most effective tools for visualizing price movements across various timeframes. Crypto traders can use these patterns to better understand market trends and develop more effective trading strategies.
Although candlestick patterns offer useful clues about potential market reversals, they should not be relied upon alone. For accurate entry and exit points, it's essential to combine candlestick analysis with other tools such as classical technical analysis, support and resistance levels, and indicators like RSI, MACD, or chart patterns. This combined approach enhances the reliability of the analysis and leads to smarter trading decisions.
