
In the world of technical analysis, candlestick patterns are considered one of the essential tools. In fact, without sufficient knowledge of these patterns, analyzing charts won't be very effective. In previous analyses, we have discussed various candlestick patterns, and this time, our focus is on one of the most crucial categories – continuation patterns. In this article, we aim to explain these patterns in simple terms to make them easier for you to understand and apply. If you are looking to enhance your skills in technical analysis, don't miss out on reading this article.
What is a Candlestick Pattern?
Among the many tools in technical analysis, candlestick charts are one of the most important for identifying continuation patterns in trends. These patterns help you analyze the historical price action of an asset and gain valuable insights into its past and potential future movements, enabling you to make informed trading decisions.
Each candlestick consists of two main parts: the body and the wick (or shadow). The middle and thicker section of the candle, representing the opening and closing prices, is called the body. The thin lines extending from the body indicate the highest and lowest prices during a specific time frame and are known as shadows or wicks.
Choosing the appropriate time frame is also crucial, as it allows for more accurate analysis of price fluctuations. Therefore, the proper use of candlestick patterns can assist you in identifying the best time to buy or sell an asset.
Understanding Continuation Patterns
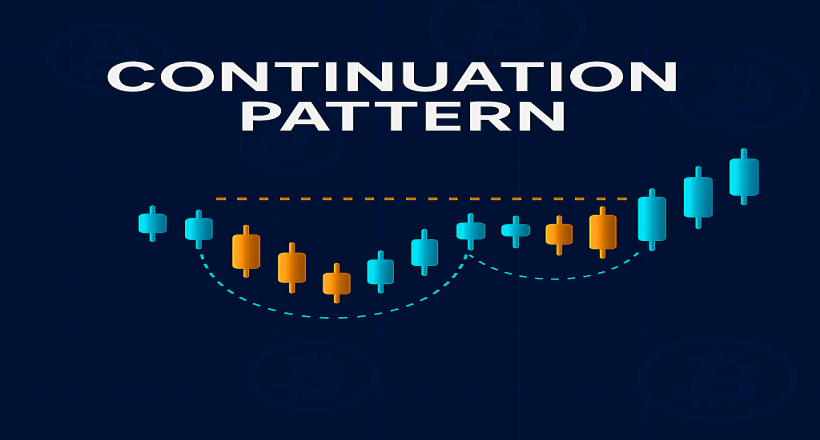
As the name suggests, continuation patterns indicate the continuation of an existing trend in a price chart. Simply put, when such a pattern appears in a trend, it signals that the current trend is likely to persist, and the probability of a trend reversal is low.
On the contrary, reversal patterns indicate a change in the trend direction and a possible price reversal. Thus, by accurately identifying continuation patterns, traders can confirm the stability of the current trend and make better trading decisions.
Types of Continuation Patterns and How They Form
In technical analysis, continuation patterns are categorized into different types to help traders easily identify them on charts and make trading decisions based on them. At first glance, these patterns may seem complex, but with proper learning and practice, they can be easily recognized and used to extract valuable price signals.
Generally, continuation patterns that form near support and resistance levels are divided into four main categories, each conveying specific signals for traders:
Continuing our Analysis of Continuation Patterns
Continuation Pattern: Triangles
Triangle patterns appear in price charts when price fluctuations gradually decrease, leading to a consolidation phase. These patterns are divided into three types based on their structure: ascending, descending, and symmetrical. To analyze these patterns accurately, familiarity with terms like pivot points is also essential.
Ascending Triangle
The ascending
triangle pattern forms when the price creates higher lows while the highs
remain fixed at a certain level. This structure indicates buying pressure and
the potential continuation of an uptrend.
Novice investors may be misled by short-term pullbacks, thinking the trend is
reversing; however, the main trend will eventually resume its upward
trajectory.
Descending Triangle
In contrast to
the ascending triangle, the descending triangle forms when the price creates lower
highs while the lows remain at a fixed level. This pattern typically signals
the continuation of a downtrend.
Experienced traders may even take advantage of small upward movements within
this pattern to make quick profits, though this requires a high level of skill
and precision.
Symmetrical Triangle
The symmetrical
triangle is slightly more complex than the other two types. In this pattern,
both the lows form higher lows, and the highs form lower highs, resulting in a
converging structure.
This setup indicates decreasing volatility and a narrowing price range,
signaling a point of indecision. After the breakout, the main trend may
continue in either direction, and identifying it depends on analyzing the prior
trend accurately.

Continuation Pattern: Rectangle
The rectangle
pattern is one of the simplest and most easily recognizable continuation
patterns in technical analysis. It forms when the price oscillates horizontally
between support and resistance levels.
If the previous trend was bullish and the price is moving within a fixed range,
it is likely that once this consolidation phase ends, the uptrend will resume.
In other words, the rectangle pattern typically indicates a brief pause in the
main trend direction, and once the price breaks out of this range, the previous
trend is likely to continue.
This pattern can be observed in both bullish and bearish markets.
Due to its simplicity, beginner traders often start by identifying this pattern
as one of their first exercises. We recommend practicing by searching for
rectangle patterns on various charts to become more familiar with its
formation.

Continuation Pattern: Pennants
At first glance,
the pennant pattern may look very similar to the flag pattern, leading many
novice traders to confuse the two. However, these two patterns have distinct
differences that must be recognized.
One of the main differences is that in a pennant pattern, the price range
becomes narrower and more compressed than in a flag pattern.
This pattern typically forms after a strong market move, whether bullish or
bearish, and the prices oscillate within a small triangular range.
In contrast, the flag pattern consists of a broader and more structured range.
The pennant pattern is also considered a sign of market consolidation before
the continuation of the main trend. Therefore, after the pennant forms, it is
expected that the market will continue moving in the same direction as the
previous trend.
Pennants can form in both uptrends and downtrends. By accurately identifying
them, traders can take advantage of optimal entry and exit points. Therefore,
traders should pay close attention to the gradual decrease in volatility within
this pattern, as the breakout is usually accompanied by an increase in trading
volume, presenting a prime opportunity to enter the market.

Continuation Pattern: Flags
As mentioned
earlier, the flag continuation pattern has some similarities with the pennant
pattern. One of its distinguishing features is the broader range compared to
the pennant.
The flag pattern typically forms during market consolidation periods. Many
investors look for trading opportunities within this pattern, especially when
the market is in a range-bound state.
Prices oscillate within a narrow range, which is one of the key differences
between flags and triangles. In the flag pattern, prices usually move in
parallel lines, indicating a more structured range.
This is in contrast to the triangular pattern, where prices gradually converge
to form a triangle shape. In other words, the range in the flag pattern can be
ascending, descending, or horizontal, whereas in the triangle pattern, the
range converges into a triangular shape.

Conclusion
In the world of
investing, no analysis is definitive, and everything is based on probabilities
and predictions.
However, by increasing your knowledge and skills in technical analysis, you can
participate in financial markets with more confidence.
Continuation patterns are highly effective tools for identifying price
direction, helping traders recognize potential market trends during
consolidation periods.
Many professional investors have successfully identified profitable
opportunities by correctly recognizing these patterns.
Therefore, if you are looking to achieve better trading results, studying and
practicing these patterns can be a significant step towards financial success.
