
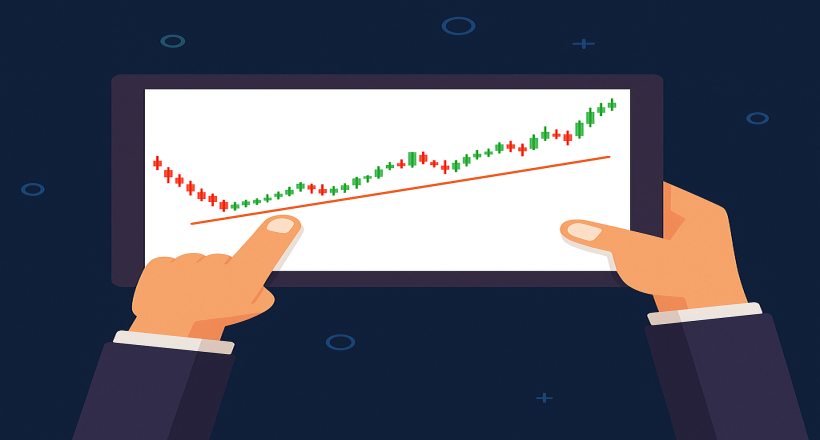
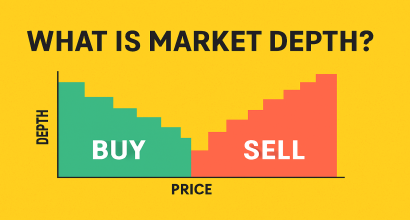
In technical analysis, a trendline is one of the most essential and widely used tools for identifying the direction of price movement in the market. To correctly understand the prevailing trend of a stock or market, both technical analysis and market depth reading (TAPE reading) can be helpful. However, before identifying a trend, it's important to become familiar with some basic concepts to draw trendlines accurately on the chart.
What Is a Trendline and What Are Its Types?
You’ve likely heard phrases like "The trend is your friend" or "Trade in the direction of the trend." But what exactly is a trend, and how does it influence trading decisions?
A trend is the general direction in which a price moves over a certain period. When the price consistently forms higher highs or lower lows, a trend is said to be forming. This trend can be upward (bullish), downward (bearish), or sideways (neutral), and it defines the underlying structure of price movement.
In technical analysis, when several consecutive highs or lows are connected, a trendline is formed. This line essentially reflects the underlying supply and demand forces in the market.
Key Characteristics of Trendlines
Unlike support and resistance lines which are drawn horizontally, trendlines are usually diagonal or sloped. These lines are drawn based on price behavior and the points where price has reacted noticeably.
Overall, trendlines help traders identify the market’s direction and align their trading decisions with the prevailing price momentum.
Types of Trends in Technical Analysis
In technical analysis, price movement typically falls into one of three main trend categories:
1. Uptrend (Bullish Trend)
An uptrend occurs when prices are rising, forming higher
lows and higher highs. In this scenario, a trendline drawn through the lows
acts as a support level, and it's expected that the price will bounce
upward upon reaching it.
In such a market, buyers are willing to pay increasingly higher prices,
which keeps pushing the price up. Even if new highs aren't significantly above
previous ones, as long as the lows are getting higher, the trend is still
considered upward.
2. Downtrend (Bearish Trend)
A downtrend forms when the market is falling, creating lower
highs and lower lows. The trendline is drawn through the highs,
serving as a diagonal resistance against any price increase.
In this trend, sellers dominate, and they are willing to sell at lower
and lower prices, putting downward pressure on the price.
3. Sideways or Range-Bound Trend (Neutral Trend)
When price moves within a defined range without a clear
upward or downward direction, it is called a sideways or neutral trend.
Here, price fluctuates between two levels of support and resistance.
Traders can take advantage of these conditions by buying at the bottom
of the range and selling near the top. However, due to the lack of a
clear direction, predicting the next move becomes more challenging.
How to Draw a Trend Line
Drawing a trend line is one of the simplest yet most effective methods for analyzing price behavior on a chart. This process involves drawing a straight line that passes through the price reversal points—either the lowest or highest points on the chart—and indicates the overall direction of the market or asset.
In uptrends, the trend line is drawn by connecting troughs (lows), as these points act as support and the price often rises again upon touching them. Conversely, in downtrends, the trend line is drawn from the peaks (highs), which act as resistance.
To begin drawing a trend line, usually two reversal points are sufficient, but for better accuracy and validity, it is recommended to use at least three points. After selecting the trend line drawing tool in your analysis software, simply identify the initial point (pivot low or pivot high), and extend the line through the subsequent points to outline the general trend.
The more times the price touches and reacts to the trend line, the stronger and more reliable that line becomes, allowing for greater confidence in its use during analysis.
Trend Line Breakout in Technical Analysis
In technical analysis, it’s important to remember that no trend line lasts forever. Eventually, a trend line loses its effectiveness and breaks. Such a breakout usually signals the beginning of a new market trend. The primary reason for this shift often lies in fundamental factors, so it’s important to refer to fundamental analysis for a deeper understanding.
A trend line breakout is considered valid when a strong candlestick (candlestick pattern) clearly breaks through the trend line and closes on the same side outside of it. It is crucial that the main body of the candlestick lies beyond the trend line. To confirm the breakout, it is usually necessary to wait for another candlestick that continues the movement of the first one, acting as a confirmation.
In some cases, the trend line is broken rapidly and without pause. However, in many instances, after the breakout, the price returns to the trend line area and “retests” it one final time. This move is commonly referred to as a “pullback.” If the pullback is successful, a new trend typically begins and the direction of price movement changes accordingly.
Trading Using Trend Lines
In the world of financial markets, there are various methods for conducting trades. One of the most important and widely used methods is technical analysis. At first glance, price charts may seem overwhelming due to the sheer volume of data and fluctuations. However, using trend lines can simplify this complexity and make it easier to understand market movements.
The back-and-forth movements of price—i.e., consecutive ups and downs—form trends. Identifying these trends helps traders select more suitable entry and exit points. In particular, during uptrends, one effective strategy is to observe how the price reacts to the ascending trend line. If the price forms a new low upon touching the trend line and signs of a bullish reversal appear, this can present a good opportunity for entering a buy trade.
Understanding Market Types in Technical Analysis
In technical analysis, markets are generally divided into two main types: trending markets and ranging (sideways) markets. A proper understanding of these two types can play a crucial role in trading decisions and increase the chances of success.
Trending Market
A trending market is one in which prices move consistently in a specific
direction—either upward or downward. This market type has a structured pattern
of consecutive highs and lows that define the overall price direction.
The stepwise and purposeful movement of prices in this type of market creates favorable conditions for trading, as identifying entry and exit points using trend lines becomes easier.
Range Market
In a ranging market, prices lack a clear direction and typically fluctuate
within a horizontal range between support and resistance levels. Unlike
trending markets, there is no clear structure of highs and lows, and price
movements often appear random or aimless.
Several factors may lead to the formation of a range market, including:
Trading in a ranging market is more challenging and usually requires settling for swing trades between the support and resistance levels. Strategies in such conditions demand greater precision and stricter risk management.
Conclusion:
Trend lines are practical tools in technical analysis that help analysts
determine the general direction of price movements over time. These lines are
drawn by connecting significant price reversal points—either highs or lows—and
provide traders with a visual representation of market behavior.
Using trend lines enables analysts to design effective trading strategies based on price action. Whether the market is trending upward, downward, or moving sideways, trend lines can serve as guides to identify appropriate entry and exit points.
However, for more accurate analysis and confident decision-making, it is recommended to use trend lines alongside other technical tools such as indicators, chart patterns, or trading volume. Combining these tools can offer a more comprehensive view of market conditions and increase the likelihood of trading success.
