
The Fibonacci tool is one of the most widely used and essential analytical tools among traders in financial markets. Technical analysts frequently utilize this tool to identify potential entry and exit points and to analyze price trends.
Proper use of the Fibonacci tool can play a decisive role in the success of trades. Therefore, learning how to use this tool correctly is essential for any trader aiming to operate professionally in the financial markets.
Understanding How the Fibonacci Tool Works in Market Analysis
The Fibonacci tool enables traders to identify key support and resistance levels on the price chart. These levels are typically derived from specific ratios in the Fibonacci sequence and can help forecast the likely direction of future price movements.
Another key capability of the Fibonacci tool is identifying suitable points for setting Take Profit (TP) and Stop Loss (SL) orders in trades. This feature helps investors reduce their trading risk and avoid significant potential losses. The use of this tool also plays a crucial role in capital management and emotional control.
Understanding the Fibonacci Sequence and Its Role in Technical Analysis
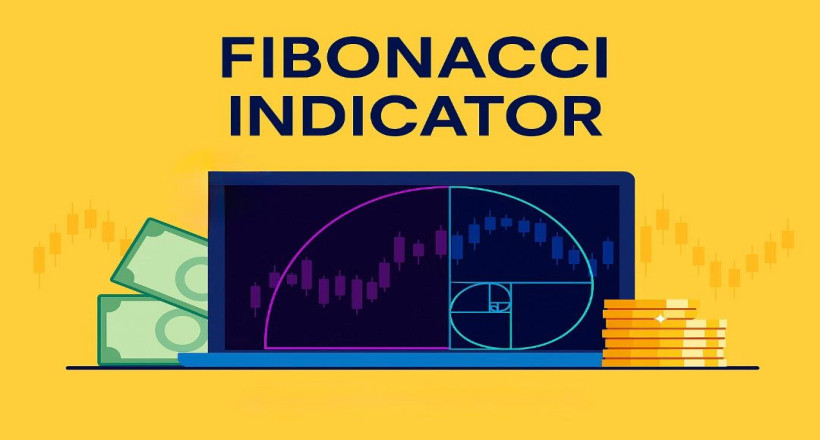
To identify key support and resistance levels on a price chart, one of the most popular tools among analysts is the Fibonacci indicator. This tool is based on a series of specific numbers known as the "Golden Numbers", which offer valuable insight into price behavior in financial markets.
A Brief History of the Fibonacci Tool
The origin of this tool dates back to the Middle Ages when an Italian mathematician named Leonardo Fibonacci authored a book in the 12th century introducing a fascinating number sequence. This sequence starts from zero, and each number is the sum of the two preceding numbers. It looks like this:
0, 1, 1, 2, 3, 5, 8, 13, 21, 34, 55, 89, 144, ...
This sequence can be continued infinitely. Evidence of this pattern can be found throughout mathematics and nature—from the growth patterns of plants to the structure of galaxies.
This sequence, known as the Fibonacci Sequence or FS, has a special characteristic: each number is approximately 1.618 times the previous one. This ratio is called the Golden Ratio and is denoted by the Greek letter Φ (Phi).
In financial analysis, these ratios are highly useful. Ratios such as 23.6%, 38.2%, and 61.8%, derived from relationships between Fibonacci numbers, are known as retracement levels. Analysts use these levels to predict potential price reversal points in the market.
Types of Fibonacci Tools in Technical Analysis
Many traders may assume that Fibonacci is just a simple analytical tool, but in reality, it consists of a collection of multiple tools, each with its own specific application in analyzing price behavior. Among the various Fibonacci tools, a few types are widely used by analysts and have proven to be highly effective over time.
Fibonacci Retracement
If your goal is to identify potential trend reversal points on the price chart, Fibonacci Retracement is one of the best tools to use. This tool is based on horizontal lines drawn at specific ratios derived from the Fibonacci sequence and helps identify key potential support and resistance levels.
In this type of Fibonacci tool, several key levels are commonly used, including:
To draw these levels, two price points — the high (peak) and the low (trough) — are selected on the chart. These levels are then plotted between those two points as follows:
Price movements often react to these lines, making them crucial in traders’ decision-making. Retracement levels essentially indicate possible points of price reversal or trend continuation.
How to Draw the Fibonacci Retracement Tool on a Price Chart
To use the Fibonacci Retracement tool on trading platforms, first select the tool from the technical analysis toolbox. The next step is to correctly identify the dominant market trend, as accurately spotting the peaks and troughs is vital for proper application.
Once drawn, multiple horizontal lines will appear on the chart, representing the key Fibonacci levels. By default, these include ratios such as 0%, 23.6%, 38.2%, 50%, 61.8%, and 100%. You can customize these levels in the tool’s settings to add or remove specific ratios as needed.
A key point to note is that price usually fluctuates between these levels. If the price breaks through one level and moves toward the next, it may indicate a strong trend. However, touching any of these levels can also lead to a temporary pullback or reversal. Therefore, these zones are highly useful for setting Take Profit, Stop Loss, and identifying entry or exit points.
Introduction to Fibonacci Arcs Tool
The Fibonacci Arcs tool identifies potential support or resistance areas by drawing several semicircles on the chart. These arcs depend on both price and time: when the arcs are wider, the associated base range is longer, and vice versa. Traders use this tool to connect key points of market swings and identify likely reaction zones.
How to Draw and Use Fibonacci Arcs
On the chart, these arcs appear as semicircles, and on some platforms, they can be drawn as full circles.
By observing where the price is located relative to these arcs—whether it stays within, touches, or breaks through them—traders can identify strong trends, anticipate market reactions, or spot potential reversal zones.
Fibonacci Extension
When the price breaks a significant resistance level and is likely to continue its trend, the Fibonacci Extension tool becomes useful. It projects levels beyond the 100% point, helping analysts estimate potential future price targets.
Key Fibonacci Extension Levels
The most commonly used Fibonacci Extension levels are:
These ratios are often used as target points and take-profit levels in trading strategies.
How to Draw and Use Fibonacci Extension
To draw Fibonacci Extensions properly, follow these steps:
Identify Two Main Waves:
Set Up the Tool on the Platform:
View the Extension Levels
Once the tool is applied, it will display the 161.8%, 261.8%, and 423.6% levels, which act as projected price targets.
Practical Example
Evaluating the Strengths and Weaknesses of the Fibonacci Tool in Technical Analysis
No analytical tool in financial markets is flawless, and the Fibonacci tool is no exception. Although it's known as one of the most widely used methods for analyzing price movements, it still has weaknesses that should not be overlooked. Below is a closer look at its advantages and limitations:
Advantages of the Fibonacci Tool
Disadvantages of the Fibonacci Tool
Conclusion
The Fibonacci tool is one of the most useful and popular tools in technical analysis, helping traders identify key price levels and determine suitable entry and exit points. Different variations of the tool—such as Fibonacci Retracement, Fibonacci Extension, and Fibonacci Arcs—each have their own specific use cases and can be highly effective in different market conditions.
However, like any other indicator, Fibonacci is not perfect, and incorrect usage can lead to flawed analysis and poor trading decisions. Therefore, it is recommended to use it alongside other analytical methods, such as price action, momentum indicators, and volume analysis, to enhance the accuracy of your predictions.
In conclusion, mastering the proper use of Fibonacci tools and practicing with real market data can turn it into a powerful guide for forecasting future price movements. When used wisely, this tool can contribute significantly to developing professional trading strategies and reducing risk in financial markets.


